
I have often seen the weather mentioned as something that could influence football results, but I have yet to see anyone looking more into it. There are various ways in which the game could be influenced by the weather, and here I am going to look into the effects of precipitation (i.e. rain and snow). I have two hypotheses about what rain could do to the end result of a game.
The first is that rain makes the grass wet, which makes the the ball bounce less and makes running harder. This, I can imagine, should give make scoring goals harder, and thus we should see fewer goals scored in matches where it rains. Also, if it rains during the match the players also get wet, which of course is a burden that should influence the game.
My second hypothesis sort of follows from the first, and that is that rain should make draws more likely.
The obvious hindrance to test the two hypotheses is lack of data. It turns out that getting good historical weather data for a given location is not that simple. The Norwegian Meteorological Institute provides free data from Norwegian weather stations, but (for now at least) I didn’t want to test the hypotheses on Norwegian football results. Instead, I wanted to test it on data from England. What I ended up doing was scraping data from English weather stations from WeatherOnline. That site provides precipitation data from British weather stations in 6-hour intervals, in a window around 1400 o’clock.
Luckily, WeatherOnline provided the coordinates to the weather stations, and I used this together with the coordinates I have compiled in my football stadiums data set to figure out which weather station were nearest. Data from the weather station closest to the place where a match was played should hopefully serve as an adequate proxy for the conditions on the field.
As part of the work on this analysis I also updated the stadium data with some additional stadiums that I needed for this project.
Unfortunately, weather data from all match dates were not available, but all in all i ended up with precipitation data for 4826 matches from the Championship and 2702 matches from Premier League, going back to 2002.
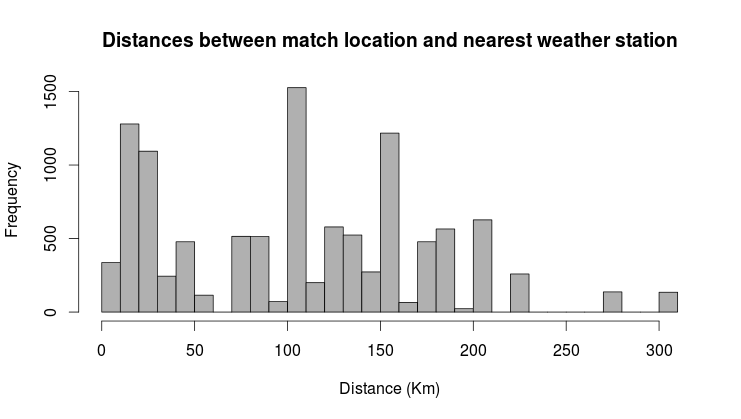
How well can we expect the numbers from the weather stations to reflect the conditions on the stadiums where the mathces are played? After I had coupled the precipitation and match data I made a histogram of the distances from the stadium to the weather station. It reveals that some of the weather stations can be quite far away, some more than 300 kilometers.
This of course is a problem. The closer the station is to where the match is played, the more accurate is the data going to be. The usual way to deal with data points that are less accurate than others, is to weight them accordingly. That way they have less influence on the parameter estimation.
But how should we decide on how to weight the different matches? What we need is a way to relate the distance to accuracy. For this we need the precipitation levels at a specific location, and the precipitation at weather stations nearby. To do this, we can use the weather station themselves, and see how well the weather stations correlate with other weather stations.
I calculated the correlations between all pairs of weather stations, and plotted them against the distance between them:

Some of the weather stations are much farther away from each other than the farthest of the ones I have coupled to the matches. We see that there is a clear trend of diminishing correlation the farther away the stations are. Since the correlations are mostly positive (between 0 and 1), they can be used as weights.
The red line in the plot is an attempt to fit a function to the correlations that can be used to compute the weights for a given distance. I fitted (using least squares) the function
where d is the distance in kilometers, \(\lambda_0\) is the value when d is 0, and \(\lambda\) is the rate in which the function decreases. The estimated values of \(\lambda_0\) and \(\lambda\) that best describes the trend were found to be 0.75 and 0.0047, respectively. Judging from the line in the plot above, it reflects the trend quite well, although there are quite some variability around it.
To test the hypothesis of fewer overall goals scored I fitted a Poisson regression model of the total number of goals scored as response. As predictors I added an indicator for matches played in the Championship, and the amount of rain in millimeters.
Each millimeter rain is associated with 0.16% more goals, which is insignificantly different from 0% (p = 0.856).
To test whether rain makes draws more likely, I used the same predictors as in the Poisson model in a logistic regression model. The odds ratio associated with each millimeter rain were 0.952, insignificantly different from 1 (p=0.165).
To summarize: I found no evidence for any of my two hypotheses. Both were insignificantly different from the null hypotheses of no effect of rain on the number of goals and the probability of draws. The point estimates of the effects were both actually in the opposite direction of what I had thought. Rain was associated with more goals and fewer draws, but not more than we would expect to see if it all was due to chance.
Have you thought about seasonality?
No I haven’t, but @clubelo on twitter posted a link to this article that shows that there are more goals scored during the summer.
this is very interesting indeed. However it seems a lot of work was put in to verify how accurate the weather data was which is awesome, But what is unclear is how you organized the data for say rain. did you categorize a set amount of inches together “1-2” – “3-4” and so on that is to say showing different results depending on more or less rain. And then did you look at not just results of games, but say Totals over/unders of say a classic parameter of (2.5). Even then did you notice certain stadiums where more/less affected by extreme weather. Suffice it to say I’m extremely interested in any data you collected id love to talk about it or see it.
I didn’t categorize the data, I used precipitation as a continuous predictor. This is the most powerful approach as any discretization would give loss of information.
The precipitation data was in millimeters, to one decimal place.
I didn’t look into specific stadiums, that could be interesting. A major confounder is of course that for a given stadium a lot of the games played will be by the same team.
Great blog. I’m an American with very little experience in football wagering, so this was very useful. Thanks! 🙂
Q. What % of premier league games incur rain (a sprinkle to deluge)?
Thanks
John
Boston
USA
Of the 7528 games in this analysis, 5777 had no rain, and 1751 had some rain.
Pingback: How Weather Conditions Impact Soccer Goals & Corner Bets – Your Blog Title