
The Norwegian parliamentary elections uses a system of proportional representation. Each county has a number of seats in parliament (based on number of inhabitants and area), and the number of seats given to each party almost proportional to the number of votes the party receives on that county. Since each party can win more than one seat the parties has to prepare a ranked list of people to be elected, where the top name is given the first seat, the second name given the second seat etc.
Proportional representation systems like the Norwegian one has been show to be associated with greater gender balance in parliaments than other systems (see table 1 in this paper). Also, the proportion of women in the Norwegian Storting has also increased the last 30 years:
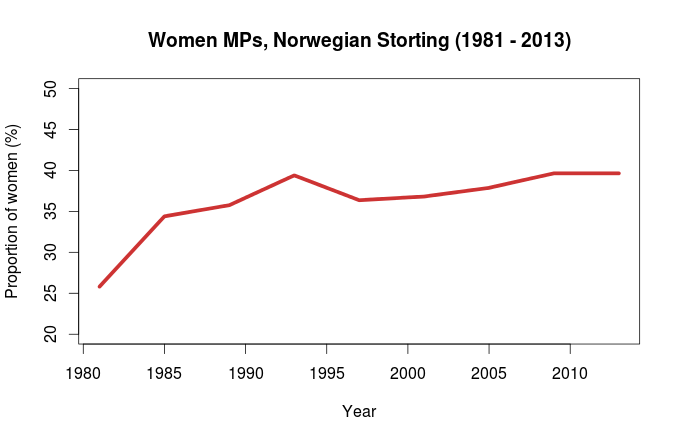
Data source: Statistics Norway, table 08219.
At the 1981 election, 26% of the elected representatives where women. At the 2013 election, the proportion was almost 40%. One mechanism that can explain this persistent female underrepresentation is that men are overrepresented at the top of the electoral lists. Inspired by a bioinformatics method called Gene Set Enrichment (GSEA) I am going to put this hypothesis to the test.
The method is rather simple. Explained in general terms, this is how it works: First you need to calculate a score witch represents the degree of overrepresentation of a category near the top of the list. Each time you encounter an instance belonging to the category your testing you increase the score, otherwise you decrease it. To make the score be a measure of overrepsentation at the top of the list the increase and decrease must be weighted accordingly. The maximum score of this ‘running sum’ is the test statistic. Here I have chosen the function \(\frac{1}{\sqrt(i)}\) where i is the number the candidate is on the list (number 1 is the top candidate).
To calculate the p-value the same thing is done again repeatedly with different random permutations of the list. The proportion of times the score from these randomizations are greater or equal to the observed score is then the p-value.
I am going to use this method on the election lists from Hordaland county from the 1981 and 2013 election. Hordaland had 15 seats in 1981, and 16 seats in 2013. 3 (20 %) women were elected in 1981 and 5 (31.3 %) in 2013. The election lists are available from the Norwegian Social Science Data Services and the National Library of Norway.
Here are the results for each party at the two elections:
| Party | 2013 | 1981 |
| Ap | 1 (0.43) | 3.58 (0.49) |
| Frp | 3.28 (0.195) | 3.56 (0.49) |
| H | 1.018 (0.66) | 3.17 (0.35) |
| Krf | 1.24 (0.43) | 2.32(0.138) |
| Sp | 2.86 (0.49) | 2.86 (0.48) |
| Sv | 1 (0.24) | 0.29 (0.72) |
| V | 1.49 (0.59) | 1.37 (0.29) |
The number shown is the score, while the p-value is in parenthesis. A higher score means a higher over representation of men at the top of the list.
Even if we ignore problems with multiple testing, none of the parties have a significant over representation of men at the top if the traditional significance threshold of \(p \le 0.05\) is used. This is perhaps unexpected, as at least the gender balance in the elected candidates after the 1981 election is significantly biased (p = 0.018, one sided exact binomial test).
This really tells us that this method is not really powerful enough to make inferences about this kinds of data. I think one possible improvement would be to somehow score all lists in combination to find an overall gender bias. One could also try a different null model. The one I have used here has randomly shuffled the list in question, maintaining the bias in gender ratio (if any). Instead a the observed score could be compared to random samplings where each gender were sampled with equal probabilities.
My final thought is that this whole significance testing approach is inappropriate. Even if the bias is statistical insignificant, it is still there to influence the gender ratio of the elected members of parliament. From looking at some of the lists and their scores, I will say that all scores greater than 1 at least indicate a positive bias towards having more men at the top.