
I had a discussion on Twitter a couple of weeks ago about which model is the best for predicting football results. I have suspected that the Dixon & Coles model (DC), which is a modification of the Poisson model, tend to overfit. Hence it should not generalize well and give poorer predictions. I have written about one other alternative to the Poisson model, namely the Conway-Maxwell Poisson model (COMP). This is a model for count data that can be both over-, equi- and underdispersed. It is basically a Poisson model but without the assumption that the variance equals the mean. I have previously done some simple analyses comparing the Poisson, DC and COMP models, and concluded then that the COMP model was superior. The analysis was however a bit to simple, so I have now done a more proper evaluation of the models.
A proper way to evaluatie the models is to do a backtest. For each day there is a game played, the three models are fitted to the available historical data (but not data from the future, that would be cheating) and then used to predict the match outcomes for that day. I did this for two leagues, the English Premier League and German Bundesliga. The models were fitted to data from both the top league and the second tier divisions, since this improves the models, but only the results of the top division was predicted and used in the evaluation. I used a separate home field advantage for the two divisions and the rho parameter in the DC model and the dispersion parameter in the COMP model was estimated using the top division only.
To measure the model’s predictive ability I used the Ranked Probability Score (RPS). This is the proper measure to evaluate predictions for the match outcome in the form of probabilities for home win, draw and away win. The range of the RPS goes from 0 (best possible predictions) to 1 (worst possible prediction). Since the three models actually model the number of goals, I also looked at the probability they gave for the actual score.
For all three models I used the Dixon & Coles method to weight the historical data that is used in training the models. This requires tuning. For both the English and German leagues I backtested the models on different values of the weighting parameter \(\xi\) on the seasons from 2005-06 to 2009-10, with historical data available from 1995. I then used the optimal \(\xi\) for backtesting the seasons 2010-11 up to December 2016. This last validation period covers 1980 Bundesliga matches and 2426 Premier League matches.
Here are the RPS for the three models plottet against \(\xi\). Lower RPS is better and lower \(\xi\) weights more recent data higher.
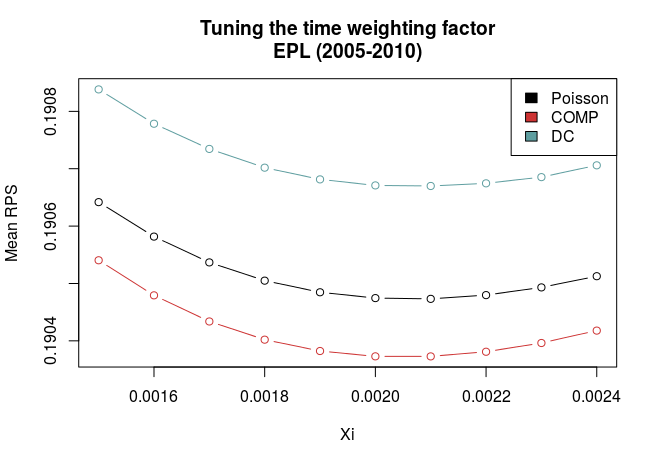
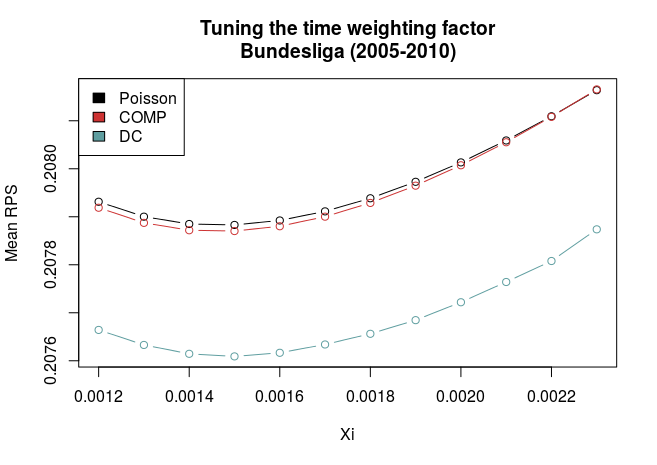
The graphs show a couple of things. First, all three models have best predictive ability at the same value of \(\xi\), and that they compare similarly also for non-optimal values of \(\xi\). This makes things a bit easier since we don’t have to worry that a different value of \(\xi\) will alter our evaluations about which model is the best.
Second, there is quite some difference between the models for the German and English data. In the English data the COMP model is clearly best, while the DC is the worst. In the German league, the DC is clearly better, and the COMP and Poisson models are pretty much equally good.
So I used the optimal values of \(\xi\) (0.0021 and 0.0015 for Premier League and Bundesliga, respectively) to validate the models in the data from 2010 and onwards.
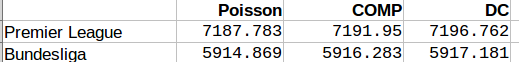
Here is a table of the mean RPS for the three models:
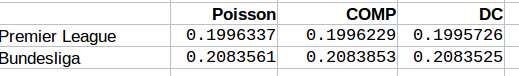
We see that for the both English Premier League and German Bundesliga the DC model offers best predictions. The COMP model comes second in Premier League, but has worst performance in the Bundesliga. It is interesting that the DC model performed worst in the tuning period for the Premier League, now was the best one. For the Bundesliga the models compared similarly as in the tuning period.
I also looked at how often the DC and COMP models had lower RPS than the Poisson model. The results are in this table:
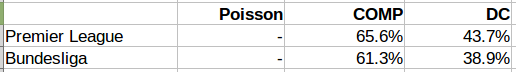
The COMP model outperformed the Poisson model in more than 60% of the matches in both leagues, while the DC model did so only about 40% of the time.
When looking at the goal scoring probabilities. Here is a table of the sum of the minus log probabilities for the actual scoreline. Here a lower number also indicates better predictions.
Inn both the Premier League and Bundesliga the Poisson model was best, followed by COMP, with the DC model last.
We can also take a look at the parameter values for the extra parameters the DC and COMP models has. Remember that the DC models is becomes the Poisson model when rho = 0, while the COMP model is the same as the Poisson model when upsilon = 1, and is underdispersed when upsilon is greater than 1.
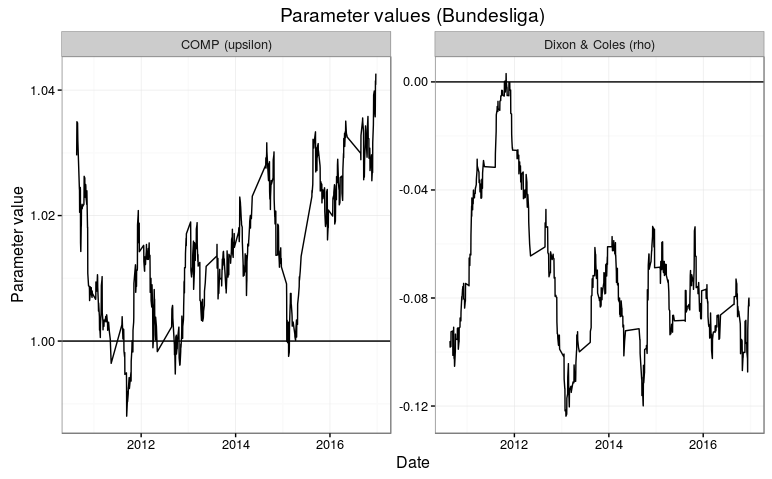

The parameter estimates fluctuates a bit. It is intersting to see that the rho parameter in the DC model tend to be below 1, which gives the opposite direction of what Dixon and Coles found in their 1997 paper. In the Premier League, the parmater makes a big jump to above 0 at the end of the 2013-14 season. The parameter appears to be a bit more consistent in the Bundesliga, but also there we see a short period where the parameter is around 0.
The dispseriosn parameter upsilon also isn’t all that consistent. It is generally closer to 1 in the Bundesliga than in the Premier League. I think this is consistent with why this model was better in the Premier League than in the Bundesliga.
All inn all I think it is hard to conclude which of the three models is the best. The COMP and DC models both adjusts the Poisson model in their own specific ways, and this may explain why the different ways of measuring their predictive abilities are so inconsistent. The DC model seem to be better in the German Bundesliga than in the English Premier League. I don’t think any of the two models are generally better than the ordinary Poisson model, but it could be worthwhile to look more into when the two models are better, and perhaps they could be combined?
You have said “used a separate home field advantage for the two divisions”.
How did you fit the MLE for both divisions (Premier & Championship) using two different Home parameters?
I imagine the easiest way is to fit the divisions separately to get the two different home parameters, then modify DCloglik to include these when fitting an overall model?
I used a two step procedure, where I first used the glm function in R to estimate all parameters except the DC and COMP specific parameters. In glm, with the formula interface, I specify the model as Goals ~ Home*Div – Div, where Home is 0-1 indicating home team, and DIV is an indicator for the division (PL or Championship). I basicly add an interaction between home and division, and then remove the main effect of division.
Due to the fact that no expert in statisticus or R, I have buid a fairly simpele Poisson model in excel for the Belgium Jupiler Pro League.
That’s my starting point.
You are lightyears ahead of me.
Could you give an indication if it is possible to integrate to Comp or Dc model in Excel?
Cheers,
Peter
That could be possible. The DC model should be fairly simple to implement in Excel. I imagine you can just calculate the tau-factor for each game (which depends on the expected number of goals for the two teams and the rho parameter), and then tune or estimate this somehow.
Hi, Jonas. Your blog is very interesting. I like to read about soccer predictions, and it’s your focus. Great job. Do you have your code on GitHub? Is it possible to share? I saw your codes about DC models, I would like to try to change some things, like the Championship.
Cheers,
John
Yes I have a github. https://github.com/opisthokonta